Useless Bench
A Look At the Worst Bench Performances in NBA History
Completed on January 23, 2021
Intro
After the Brooklyn Nets fell to the Cleveland Cavaliers 135-147 on January 20, 2021, I came across a Reddit post that pointed out that the Brooklyn bench scored just 10 points in more than 71 minutes of action. Granted, only four players (Joe Harris, Timothé Luwawu-Cabarrot, Reggie Perry, and Bruce Brown) played at all off the bench in such a high-scoring thriller, but 10 bench points in any game is a recipe for disaster.
I was curious to see just how historically rare of a game this was for the Nets bench, and so this analysis was born. Enjoy!
Disclaimer
I want to preface this by saying that this is absolutely not a comprehensive analysis. You can easily argue that so many other metrics should have been used instead to evaluate "performance"; it just happened that this analysis is based on points and minutes, which I chose because they were what stood out to me in the beginning. In addition, I defined performance to be "worse" if and only if both points were lower and minutes were higher. This is a pretty critical definition that will eliminate some games from my analysis, but I don't believe other definitions would have made meaningful contributions. Finally, this is purely for fun and to satiate my curiosity, so please don't take it too seriously. All that being said, feel free to take a look and let me know what you think!
Methodology and Materials Used
I had recently scraped NBA box score data for one of my other projects, and it was almost perfect for my purposes today. I had taken basic box score data from all games starting from the 1996-1997 season to December 31, 2020, and aggregated them all into a .csv file (available on Kaggle). The only adjustment I had to make was to write a quick macro to determine whether players were starters, but otherwise the data was already good to go.
My goal was to see how many games in my dataset saw bench production as bad or worse than the Nets, in terms of several metrics and filters. For the final notebook, I arranged my findings in rough order of increasing specificity.
Attempt 1
I started out by naively using summarize() and pivot_wider() functions to summarize each game. However, it became clear when taking a look at a couple data points that this includes situations in which only one or two players come off the bench, which is much less impressive and not quite what we’re looking for.
first_try %>% head(10)For instance, take a look at the game between the Miami Heat and Philadelphia 76ers in 2015.
For context, this was the final game of the season for the Heat, so the normal starters were given the night off, and the benchwarmers got to start and play pretty much all 48 minutes. While interesting, this isn’t exactly what I was looking for. We had to start again somewhere.
Attempt 2
This time, I was a bit more thorough in adding more columns for the number of players off the bench as well as the total points and minutes of both the starters and bench.
starters_data %>% head(10)We can mess around and find some pretty neat games.
Most Points Scored by Starters
Most Points Scored by Starters (Accounting for Overtime)
Most Minutes Played by Starters
Most Minutes Played by Starters (Non-Overtime Only)
Most Points Scored by Bench (Accounting for Overtime)
The fourth game, by the Dallas Mavericks, is actually my favorite game of all time. In Game 4 of the 2011 Western Conference Semifinals, my Mavericks blew out the reigning champion Lakers on the road in Phil Jackson’s last ever game as a head coach. I remember watching the whole game live and being amazed by the utter domination by the Jason Terry-led bench. Even today, I can still recall several of the key stats, including that the Mavs bench scored exactly as many points as the entire Lakers team. In addition, Terry alone scored 32 on 9-10 from three, and Peja Stojakovic tacked on 6 more threes on 6 attempts. In total, the Mavs made 20 from long distance, which at the time was a lot.
Most Minutes Played by Bench (Accounting for Overtime)
This one in particular surprised me; how in the world do the starters only play for 10 minutes? Looking at the box score for the Kings-Timberwolves game, it’s incredible that the five of the six players with the least minutes that game were starters, and the other games don’t look much better. However, it all makes sense when considering that the Kings were in the midst of an exhausting road trip, this being their third game in four nights. As a result, they were down by 36 within the first half, prompting Coach Joerger to pull all of his starters out of a meaningless unwinnable game. The other games in the top 5 were all the last games of their season, where coaches of playoff-bound teams opted to let their starters play for just a little bit; note that three of them were played on April 16, while the last was a part of the COVID-induced 2020 bubble season.
Analysis
Going back to our main question, how historically bad was the Nets bench against the Cavs? First let’s see how many benches have scored 10 points or less.
2146 games, which over 24 years accounts for about 100 games per year, about one game for every team. So this isn’t particularly rare. In some games, however, like the Heat game, this is inflated by games in which only a couple bench players actually get minutes.
What if we add the restriction that at least four players actually play off the bench?
1728 games, which didn’t really narrow it down too much. Still at about a game per team per season.
What about scoring 10 or less while four or more players play for at least 71.13 minutes, like the Nets did?
128 games. Apparently it’s pretty hard to not score many points while collectively playing more than the equivalent of a whole quarter.
To be fair though, they did play in double overtime, so let’s take overtime out of the picture.
563 games. That provides a little bit of redemption, but this was a really high scoring game, so let’s take a look in terms of the proportion of total points scored.
Only 96 games now. This is the strictest filter we can reasonably apply, so the fact that this still occurs roughly 4 times a year is pretty surprising. As a Mavericks fan, I’ve been fortunate to watch a team that, no matter how we poorly do overall, always has solid contributions from the bench.
starters_data %>%
    filter(TEAM == "DAL", ReservePoints / TotalPoints <= 10 / 135, Reserves >= 4, ReserveMinutes / TotalMinutes > 71.13 / 290) %>%
    arrange(ReservePoints/TotalPoints)
Here are the teams with the least such games after our championship run in 2011.
I also wanted to take a look at the frequency of such games over time.
starters_data %>%
    filter(ReservePoints / TotalPoints <= 10 / 135, Reserves >= 4, ReserveMinutes / TotalMinutes > 71.13 / 290) %>%
    select(Year) %>%
    ggplot(aes(x = as.numeric(Year))) +
    stat_bin(fill = "orange", color = "black", breaks = 1995:2020) +
    labs(title = "Nets-esque Games",
         x = "Year", y = "Count") +
    theme(plot.title = element_text(hjust = 0.5))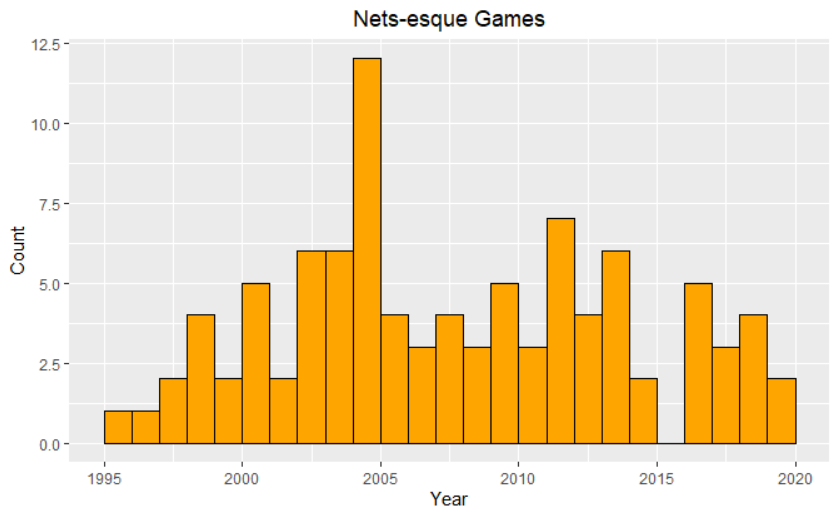
Although the occurrences are decreasing in recent years, it’s a bit jarring to see that quite often teams’ starters have to carry their teams to this extent. For instance, the Celtics bench played 2 such games in 2020 alone, and had 2 additional games in which they scored less than 10% of the points in >25% of the playing time. I think we can probably expect the Nets to see a few more such games this year.
Finding the Most Impressive Game
For this brief section, I wanted to pinpoint a single game in which the bench was the most useless in terms of points, minutes played, and number of players.
starters_data %>%
  filter(ReservePoints / TotalPoints <= 0.05, Reserves >= 4, ReserveMinutes / TotalMinutes > 1/4) %>%
  arrange((ReservePoints + 1)/(TotalPoints + 1)) %>%
  select(TEAM, OPPT, Year, Reserves, ReservePoints, ReserveMinutes)
In my personal opinion, I think the winner is the 1998-99 Los Angeles Lakers. In Game 1 of the Conference Semifinals against the San Antonio Spurs, their bench mustered up 2 measly points in 62 minutes on 1-12 shooting from the field, 0-5 from three, and a combined 5 rebounds, 2 assists, 1 steal, 1 block, 1 turnover, and 8 fouls. Unsurprisingly, they lost that game by 6 and were swept by the eventual NBA champions.
Conclusions
As surprised as I was to hear that the Nets bench only scored 10 points, I was even more shocked to see that such abysmal games occur about 4 times a year, although the frequency appears to decreasing from a peak in the early 2000’s. Future analysis could involve finding more causal relationships or exploring the effect that superteams like the Nets have on their occurrence.
In addition, bench performance is generally regarded as a positive contributing factor to winning games. It would be interesting to examine the relationship between bench performance and win percentage or other performance metrics.
Thanks for reading!