Bad Blockers
A Different Way to Evaluate Blocked Shots
Completed on April 11, 2021
Intro
As a Mavericks fan, I was inspired to run this analysis after watching many of our games and noticing an annoying trend: ineffective blocks. Kristaps Porzingis and Maxi Kleber are our main rim protectors, averaging 2.3 and 1.6 blocks per 36 minutes in the 2019-20 season. However, at least according to the eye test, it feels like the ball never ends up in a Maverick’s hands and instead is emphatically put back with the defending big man now out of the picture. But is this normal? How often do offenses score anyway after being blocked, and how do Porzingis and Kleber compare to other big men in that regard?
Methodology and Materials Used
The dataset of blocks from about 30,000 games was (laboriously) scraped from Basketball Reference’s play-by-play archives, which are generally very accurate but have occasional errors (ex. entries in the wrong order). A Python script was used to summarize each possession involving a block and aggregate its output for all games from the start of the 1996-97 season until Februrary 27, 2021, into a CSV file (available on Kaggle).
Disclaimer
Data for this analysis was scraped from about 25 years of play-by-play data. Unfortunately, inconsistencies in the source archives result in some nonsensical data values in my dataset that are hard to clean on my own. However, while working with the data, I verified that these outliers make up less than 2% of the entries, so our analysis shouldn’t be affected too much. However, it’s unclear how the un-cleaned data is distributed; older years could likely be affected more, which would skew the findings when comparing players across eras.
Offensive Rebounding and Why It’s Bad
To set the foundation of our analysis, we first need to verify what we suspect from our eye test: that bad blocks hurt the defense’s ability to prevent points. For this article, bad blocks are blocks that lead to offensive rebounds and result in quick putbacks before the shot blocker can get back into position; quantitatively, these include possessions that end within 3 seconds of the first block and in which the block is immediately followed by an offensive rebound to a player. Clearly, this is a simplistic definition, but it identifies most of our desired plays while excluding defensive rebounds, blocks that go out of bounds, and plays where the offense resets after an offensive rebound. Although a few other plays will inevitably be miscategorized, this will be straightforward and accurate enough for our purposes.
Breakdown by Category
Using this definition, the numbers clearly confirm our eye test. First, offensive rebounds can be categorized into either team rebounds, where the ball touches a defender and ends up out of bounds, or individual rebounds, where the rebound was made by an offensive player. In total, the two categories occur roughly equally in frequency, but possessions with individual offensive rebounds result in an average of 1.12 points, compared to just 0.86 after team rebounds. For reference, the average offense in 2019-20 scored 1.10 points per possession, 1.06 after a made shot, 1.10 after a missed shot, and 1.25 after a turnover.
The disparity is even more clear after considering length of possession (in particular, whether the possession ends within three seconds of the first block). As one might expect, fast team rebounds are far less likely to score, at only about half a point per possession. In general, these are late-shot clock situations in which the offense has less than three seconds left to inbound the ball and put up a shot. Team rebounds with more time fare better, at almost a full point per possession. In stark comparison, resetting the offense after an offensive rebound results in roughly the same output as a normal half-court offense, while shots taken before the defense can reset do even better.
The high output in the latter category is even more impressive when one considers shot clock violations. Often, blocks end possessions not via a defensive rebound but rather by causing a shot clock violation. As long as the ball does not touch the rim, the shot clock continues running and can expire before the offense has a chance to attempt a putback. Because this analysis is focused on possessions with second-chance opportunities, we can reasonably exclude these late-clock situations that “artificially” end possessions early. After shot clock violations are removed, the average points per possession rises to a solid 1.261, comparable to transition opportunities after turnovers which are considered the easiest points in basketball. For reference, the Cleveland Cavaliers were the most accurate team within 5 feet during the 2019-20 season at 65.3%, corresponding to 1.306 points and that limiting these opportunities should be one of the goals of a good rim protector.
Block Count Analysis
The effects are clear when analyzing the expected points scored in possessions with multiple blocks: in possessions with one, two, or three blocks, the expected number of points scored increases from 0.432 to 0.453 to 0.503, respectively. This initially seems counter-intuitive, but our findings about offensive rebounds helps explain this trend.
First, an alternative hypothesis would be that fouls are called more often after several blocks, leading to free throws that inflate the average. The chart below displays the relative frequency of 2-pointers, 3-pointers, free throws, and turnovers in percentages. As predicted, the frequency of trips to the free throw line steadily increases from 5.2% up to 6.8%, but the frequency of turnovers (either via shot clock or loose balls) also increases as block-fests continue. Thus, the increase in points scored is most likely not fueled by the small rise in fouls.
However, when we look at the expected points scored for each category, both two-point and three-point shots increase when the number of blocks increases. Somehow, offenses get better shots from field after blocks, which can neatly be explained by offensive rebounds. Even though blocks are typically seen as good defensive plays, they leave the defense susceptible to second-chance or even third- or fourth-chance points when the offense is able to rebound their own miss. This is precisely what this article seeks to explore: the ability of defenders to stay in position or secure a defensive rebound and prevent further damage.
(Note: one possible caveat to consider is survivorship bias; the players securing offense rebounds are likely to be bigger and stronger and have an advantage at the rim, suggesting an inherent difference between one-block and multi-block possessions. This bias most likely has some effect, but the significant difference between double- and triple-blocked shots, where such a difference doesn’t exist, indicates that it’s not a particularly strong influence.)
Individual Player Analysis
Let’s return to our question: which individual players perform well, and how will Porzingis and Kleber stack up?
For this section of the analysis, we will evaluate established blockers who have amassed at least 400 blocks throughout their careers using the following metrics:
- Points scored per block (PPB) - average number of points scored per possession in which the player had a block
- Defending rebounding ratio (DRR) - proportion of blocks by the player immediately being secured via a defensive rebound
- Points scored per offensive rebound (PPO) - average number of points scored when the player’s block resulted in an offensive rebound
For reference, here are the 95th, 75th, 50th, 25th, and 5th percentiles of each metric.
These statistics were chosen over raw block numbers because they are better indicators for the ultimate goal of a defense: to prevent points. For the remainder of this article, we will apply this lens to judge these players and identify the best of the bunch.
Best of the Best
As expected, some household names show up in this elite group. At the top of the list, Kawhi Leonard is one of the premiere 2-way players in the league and accordingly won Defensive Player of the Year honors in 2015 and 2016. At second, Arvydas Sabonis played only 7 years in the NBA and is considered one of the most intriguing what-if stories. But in those seven seasons, Daddy Sabonis had an average offensive rating of 112, while his defensive rating was consistently between 94 and 97. Similarly, at third, Valunciunas is generally considered a plus defender, with his defensive ratings in all 9 seasons sitting between 103 and 108.
The fourth name on the list is Greg Ostertag, who played most of his 11-year career in Utah. According to Ryan Aston of Fansided, “Tag” was an underrated defensive stalwart who posted a positive defensive plus/minus every year and finished in the top 10 in the league three times. In terms of blocks, his 1.7 blocks per game and 1293 career blocks both rank within the top 50 all-time.
At number five is our first surprise entry of Chris Webber, who was better known for his offensive prowess. But in the seasons after 1996, his almost 1000 blocks allowed a surprisingly elite 0.353 points per block, and he had an impressive 60.8% defensive rebound ratio. In his physical prime from 1998-2003, his defensive rating sat below 100 every year, and he ended his career with about a third more Defensive than Offensive Win Shares (47.8 vs. 36.9). Although many greats were very solid on defense, it’s quite noteworthy that Webber edges out many more established defensive stalwarts, as the remaining five players in the top 10 (Giannis, David Robinson, Brandon Bass, Hakeem, and Theo Ratliff) collectively share 7 blocking titles and 4 DPOY awards.
Evaluating Historic Blockers
It’s fun to see which players are the “best”, but how favorably do these metrics view the historic greats with the hardware to back it up? Of course, Dikembe Mutombo is the first to come to mind as a 3x block champ, 4x DPOY, and owner of the signature finger wag. How do he and others stack up?
In total, this section assesses the DPOY and top 5 blockers of each year going back to 1990, filtering for those with at least 400 blocks in the dataset (which starts tracking in 1996). The resulting list of 52 players is absolutely studded with defensive stars but also a few lesser-known players; let’s try and order them somehow. As a rough measure, an adjusted geometric mean of their ranks in each of the three categories will be taken as their overall score. To account for the fact that PPB and DRR seem to be more important than PPO and to reduce the sensitivity of the geometric mean to outliers, the overall score will be calculated using the formula
\[ \text{Overall_Rank} = \sqrt[3]{(\text{Points_Rank} + 3) \cdot (\text{Defense_Rank} + 3) \cdot (\text{Offense_Rank} + 12)} - 6. \]
As we’ve mentioned before, Kawhi Leonard and Greg Ostertag are by far the most impressive defenders, topping both of the first two lists. Mutumbo indeed lives up to his name, squeaking into the top 10 thanks to an elite 62.5% defensive rebounding ratio. Looking down the list, we see legends like David Robinson at 4, Alonzo Mourning at 7, and Tim Duncan at 11. But there are a few surprising contenders: fringe stars Clint Capela and Marc Gasol sit at spots 8 and 9, and Draymond Green and Kevin Durant are the first two non-centers at 12 and 15, respectively. Perhaps the biggest surprise was Larry Sanders, who snagged first in points per offensive rebound. He wasn’t really a household name during his relatively short 6-year career, but he actually ranked second in blocks per game during the 2012-13 season with an incredible 2.83 BPG.
Mavericks
So how do the Mavs defenders stack up? First, let’s take a look at their numbers.
In my opinion, these findings verify my initial eye test. Unfortunately, compared to other shot blockers, Porzingis and Kleber are both not elite. Fortunately, they’re not bad either. Let’s see how they rank among established blockers.
As the table indicates, KP is a mediocre blocker, with an surprisingly elite defensive rebounding ratio. Unfortunately, Maxi is below average in all regards, which is unfortunate because he’s my favorite player. In particular, both he and KP are dreadful at following up on offensive rebounds and rank in the bottom quartile in that respect.
A New Metric: Points Averted
Returning to the bigger picture, let’s take another look at how the 52 elite shot blockers perform in these three metrics compared to the “run-of-the-mill” center. To no one’s surprise, a majority of about two-thirds performed better than the median in each of the three categories (37, 34, 32 out of 52). However, that means that a sizable number of these elite players perform below average. Below is the tail end of elite shot-blockers.
Interestingly, some of the most prolific blockers in the NBA are actually terrible in terms of ending possessions and preventing points, the ultimate goals of defense. Some entries of the list even placed below the twentieth percentile in those areas, and Emeka Okafor actually allowed the sixth highest PPB of all players with at least 400 career blocks. It’s worth noting that the data scraping is much less reliable for older players like Okafor, Turiaf, and Camby in the 2000’s, but assuming that the data is reasonably accurate, I think this discrepancy motivates us to re-evaluate the value of a block. Should we really treat all blocks equally in the box score, regardless of how the possession ends? Who should we really consider to be good blockers then? Morale and entertainment reasons aside, should defenders swat the ball out of bounds or rather try to tip the ball to themselves, or should they even go for the block and risk fouling? These are possible questions that should be discussed or explored further in future analysis, but for now, let’s attempt to re-evaluate the value of a block numerically.
As we’ve mentioned previously, the primary objective of a defense is to keep the other team from scoring points. Thus, it’s reasonable to evaluate an individual player’s contribution through blocks by estimating the points that those blocks “prevented”. In other words, we can define the number of “points averted” as the difference between the expected number of points had the shot not been blocked and the number of points actually scored in those possessions. Numerically, this would be
\[ \text{points averted} = \text{league average points per possession} \times \text{number of blocks} - \text{points given up}, \]
where the constant is about 1.1 throughout our dataset (note: we can use the league average value for each year but this won’t make a difference when comparing players within years). Here are the league leaders in total blocks and points averted each year (including playoffs):
As expected, most years have the same player on top in both categories. Interestingly, Brook Lopez replaces Myles Turner and Hassan Whiteside as the most impactful blocker in 2018 and 2019, respectively.
Brook Lopez
Looking at those two seasons, Brook averaged an eye-popping 0.328 and 0.278 points per block, which propelled him over Myles Turner and Hassan Whiteside, respectively. Perhaps on a related note, Brook also recorded career highs in defensive win shares in those two seasons at 4.3 and 4.1; the next highest was in his rookie season at only 2.7.
Notably, these were his first two seasons on the Milwaukee Bucks after spending most his career on the Nets. With Giannis to absorb most of the offensive workload, Lopez’ role instantly shifted towards the defensive end of the ball, which led to such an efficient season protecting the rim. Unsurprisingly, the Bucks instantly shot from 18th in the league in defensive rating in 2017 up to 2nd in 2018 and 1st in 2019. It’s not clear just how much the addition of Lopez contributed to this rise or whether Milwaukee’s distinctive drop defense inflates his numbers, but he was undoubtedly valuable to the team in patrolling the paint and deserves his fair share of credit.
One thing to note is the Myles Turner had a monster year in 2018 as well, allowing only 0.353 points per block. However, Lopez was able to edge him out by just two and a half points averted for the title. In comparison, Hassan Whiteside in 2019 allowed a dreadful 0.530 points per block and gave up the crown to a player with 33 fewer blocks.
Self-Rebounding
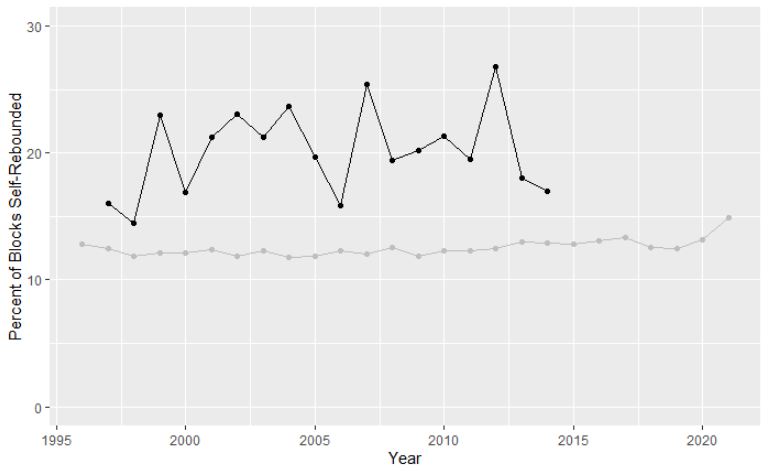
One relatively unrelated but fun aspect I would also like to investigate is the ability of a player to block the ball and secure the defensive rebound himself. Tim Duncan was notorious for being the master of this craft, but are any other players comparable? A quick search shows us which players have had the most such “self-blocks” in their careers:
Clearly Timmy is the undisputed champion, and it’s not even close. Among the top 30 in total self-blocks, only he is able to secure them at a rate above 20%. Looking across his career, it’s really impressive how significantly above league average he is in this regard. Interestingly, note that the league average has risen greatly in the past two years; it should be worthwhile to reexamine in a few years whether this observation is a random, COVID-related, or legitimate long-term trend as defenders become more skilled and ball-savvy.
All in all, it’s incredibly rare for players to be able to rebound their own blocks at 20%, not to mention play for 20 seasons and make it into the top 5 all-time in blocks. Timmy’s 710 self-blocks is likely among the most unbeatable NBA records that will still stand hundreds of years from now.
Conclusion
In this article, we’ve examined blocks in terms of how effectively players are able to end possessions and prevent second-chance points. In this light, certain underrated players like Greg Ostertag, Chris Webber, and Brook Lopez shine, but others who are well-known for their blocking prowess statistically don’t actually help their teams as much. In my eyes, the next step is to rerun the analysis with new data, as I don’t have complete confidence in the accuracy of the scraped data points before 2010. If the findings stand, then it would be extremely valuable to investigate the causal reasons why some players are just better at securing defensive rebounds or preventing second-chance points. I’ve discussed this briefly with some of the folks at B-ball Index, and some possible factors we think are worth exploring include blocking technique (allowing the defender to stay in position) and playing in defensive schemes that prioritize having guards that’ll rotate down and box out to cover for the shot blockers; answering this question is daunting but can be answered using XYZ data. Another interesting aspect to consider is longitudinal trends of whether players over the years are getting better at creating these “good blocks” and “self-blocks”.
Thank you for reading! Do you agree? Disagree? Want to discuss anything? Please feel free to contact me at kh19[at]princeton[dot]edu.